Model Bar chart response - Tea and Coffee
Model Bar chart response - Tea and Coffee

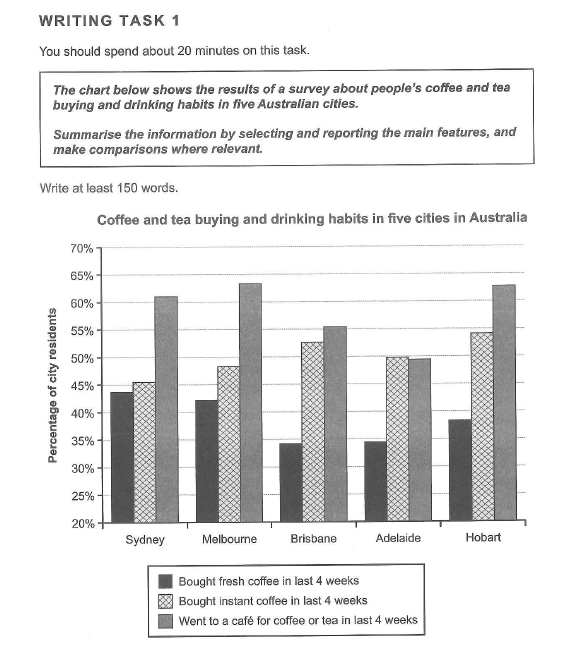
A survey about the buying and drinking behaviour for coffee and tea in the last four weeks was carried out in five Australian cities, namely Sydney, Melbourne, Brisbane, Adelaide, and Hobart. From the survey results, it was discovered that while majority of residents across the cities went to cafes for their drinks during the period, much smaller proportions of residents demanded for instant coffee or fresh coffee, the latter being the least demanded generally.
In Sydney, Melbourne and Hobart, not less than 60% of their residents went to cafes either for coffee or for tea. Those who purchased instant coffee instead ranged from about 45% to just below 55%, while the demand for fresh coffee never got to 45% in any of the cities.
The situation was slightly different in Brisbane and Adelaide, however. In Brisbane, the dominant category was still those who went to cafes, but this time around, this category (a little above 55%) was closely followed by those who purchased instant coffee (about 52%). The case in Adelaide was even more interesting. The demand for instant coffee slightly edged the demand for prepared coffee or tea in cafes, though both recorded figures around 50% of residents. Finally, just like in other cities, the demand for fresh coffee remained the least (under 35% in either city).
218 words
To stay updated on our latest blog posts, subscribe to our newsletter and follow us on social media platform. We look forward to embarking on this educational journey with you and creating a community of learners passionate about the power of education.


Comments (0)