Model Pie Chart Academic Writing Task 1 Response on Nutrients
Model Pie Chart Writing Task 1 Response on Nutrients
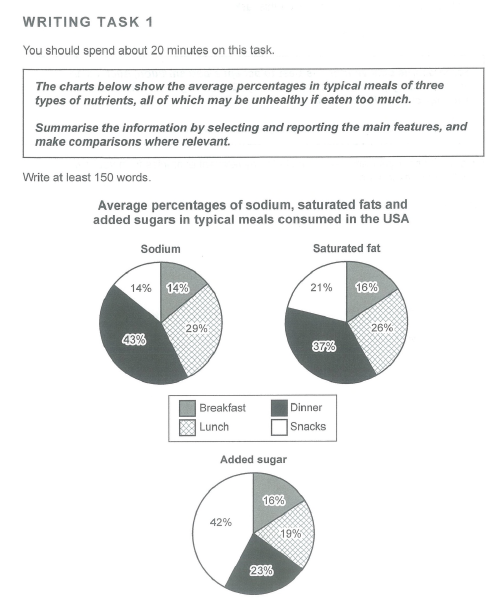
The pie charts reveal the averages of three high-risk nutrients contained in four major meals consumed by residents of the USA. The nutrients comprise Sodium, Saturated fats and Added Sugar, and the units are measured in percentages.
Overall, the nutrients were majorly contained in foods eaten as dinner, while the other meals had fair shares of each nutrient. It can also be observed that added sugars were mostly included in snacks as compared to other meals.
With respect to the proportion of sodium and saturated fats eaten in the four meals, Americans took in large percentages of them in dinner. While 43% of sodium is consumed in an average dinner, the rate of saturated fat found in such meal is lower (37%). On the other hand, under 30% of either nutrient is eaten in lunch. As regards breakfast and snacks, while the same proportion of sodium (14%) is contained in either meal, snacks contain 5% more saturated fats than breakfast (16%).
The share of Added sugar across the four meals is quite different. An average snack comprises 42% of the nutrient, a figure almost twice the proportion of the nutrient consumed in dinner (23%). People’s breakfast and lunch however had milder sugar content, with the former having the least proportion (16%).
In conclusion, the three nutrients were mainly consumed in dinners and lunch.
223 words
To stay updated on our latest blog posts, subscribe to our newsletter and follow us on social media platform. We look forward to embarking on this educational journey with you and creating a community of learners passionate about the power of education.


Comments (0)